
Returns you can measure
We agree the KPIs with you before go-live and measure them again afterwards, so the value shows up in numbers, not promises.
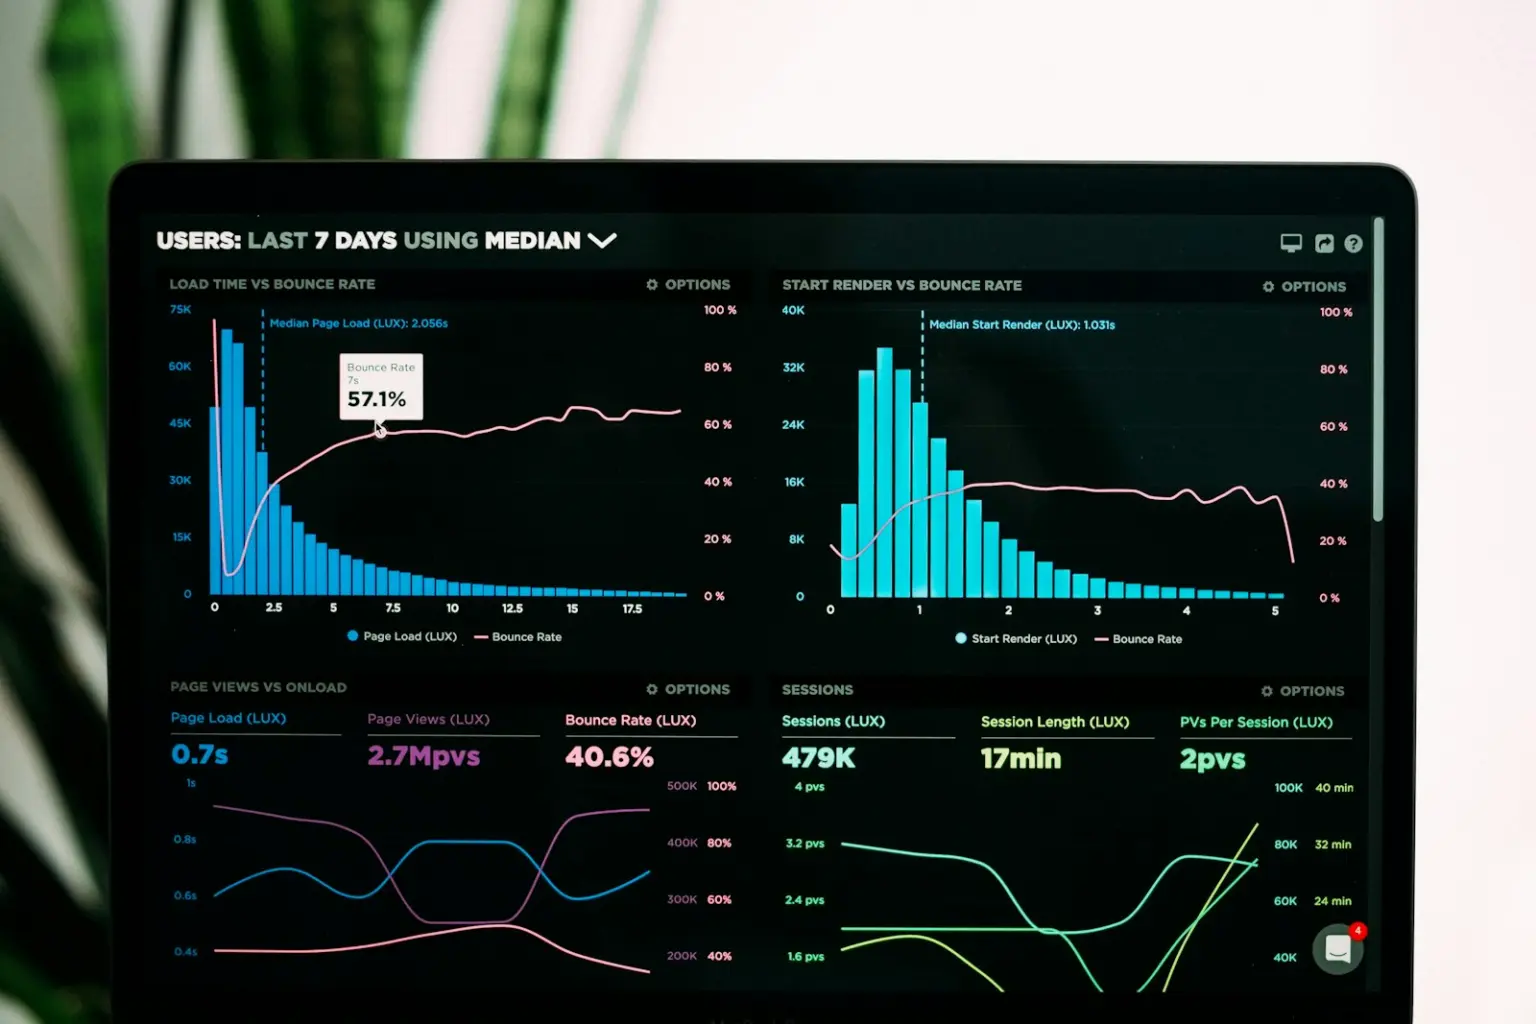
Results from live customer programmes
30%
Lower planning latency at Höganäs
99.8%
Accuracy in quality verification at Bharat Forge
40%
Less unplanned downtime at Alfa Laval
25%
Higher throughput at Crompton Greaves
Work out your own return
Move the sliders to match one process you run today. The estimate updates as you go.
Estimated annual saving
$264K
$264,000 a year
Set the time with agents below the time it takes today to see a saving.
733hrs
saved per month
4.6FTE
of staff capacity freed
How it is worked out
hours / month = 2,000 × (25 − 3) min ÷ 60annual saving = hours / month × 12 × $30FTE freed = hours / month ÷ 160 working hoursAn illustrative estimate from your inputs, not a quote. In an ROI session we replace these with your measured baseline.
Eight metrics we track before and after
Speed, accuracy, running cost and risk. Each one has an agreed baseline, a target and a formula, so everyone reads the result the same way.
Time to build a new automation
Formula: Build days saved × developer day rateImpact: Faster time to valuePurchase order processing time
Formula: Minutes saved per order × monthly orders × hourly staff costImpact: Lower processing costProcurement cycle time
Formula: Days saved × cost of delay per dayImpact: Healthier cash flowInvoice error rate
Formula: Error rate × average invoice value × monthly volumeImpact: Revenue recoveredManual data re-entry
Formula: Documents per month × minutes per entry × hourly staff costImpact: Capacity freedUpkeep when a screen changes
Formula: Maintenance hours saved × developer hourly costImpact: Lower running costERP reporting effort
Formula: Weekly hours saved × hourly staff cost × 52Impact: Time returned to the teamAudit preparation
Formula: Preparation cost + reduced penalty riskImpact: Lower compliance risk
Typical before and after ranges. Your own baseline is measured during discovery and replaces these figures.
Tracked from day one
Pick the quickest win
We review your highest-volume processes and point to the one that will pay back first.
Go live fast
Within about two weeks, connected to your ERP and enterprise systems, with workflows configured and your users trained.
Review it every quarter
Your customer success manager tracks the return and walks you through it at each quarterly business review.
Ready to put a number on it?
In a free session we will set these metrics against your own operation.